



InnoX
See Deviat
VARIANCE ANALYSIS AND REPORTING

See Deviations. Understand Why. Act Confidently.

Automates variance calculation, reports, root-cause drill-down, trend visualization, performance integration, custom reports, and decision support for complete variance intelligence.

Detect Variances Instantly. Understand Root Causes. Act with Confidence.

Budget variances are inevitable. But discovering them weeks after month-end , with no clear understanding of why they happened, is a choice. This sub-module gives you real-time variance detection, drill-down analytics to find root causes, trend visualization to see patterns, custom reports for any stakeholder, and decision support tools that turn insights into action. Stop guessing. Start knowing. From variance to insight to confident decision in minutes, not days.

Detect Variances Instantly with Automated Calculation

Automatically calculates differences between planned and actual figures , revenue, expenses, margins, and KPIs , highlighting deviations the moment they occur. No more waiting for month-end spreadsheets. No more manual calculations. Real-time variance detection means you catch problems early, when you can still do something about them.

Performance illustration
Budget Variance Calculation & Detailed Financial Reporting

Budget Variance Calculation & Detailed Financial Reporting

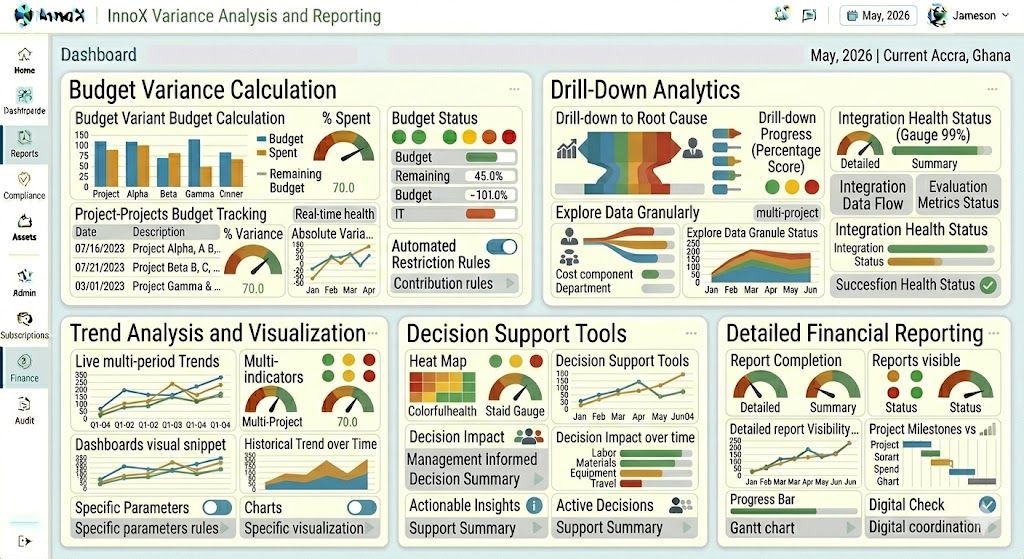
Automatically calculates differences between planned and actual figures revenue, expenses, margins, and KPIs highlighting deviations in real time. Generates comprehensive reports that provide insights into financial performance across departments, projects, and cost centers.

  • Automated variance calculation: Real-time differences between planned and actual figures across all budget categories
  • Comprehensive financial reports : Department, project, and cost-center performance insights at your fingertips
  • Exception highlighting : Variances above thresholds are flagged automatically for management attention

Drill-Down Analytics & Trend Visualization

Drill-Down Analytics & Trend Visualization

Allows users to explore data at a granular level to identify root causes of variances. Uses charts, graphs, and dashboards to display financial trends over time for better understanding. Click from high-level dashboard to the exact source of the deviation.

  • Granular drill-down : Click from department variance to specific transactions, from project overrun to individual purchase orders
  • Interactive trend visualization : Line charts, bar graphs, and heat maps show patterns over days, months, or years
  • Root-cause identification : Understand the "why" behind every variance, not just the "what"

Discover More with InnoX

Stop managing budgets across disconnected spreadsheets. InnoX unifies every aspect of budget management , from multi-scenario planning and real-time expenditure tracking to grant fund allocation and variance analysis.

Custom Reports, Performance Integration & Decision Support

Custom Reports, Performance Integration & Decision Support

Enables users to create tailored reports based on specific organizational needs. Shares financial data with performance management systems to support evaluation metrics. Provides actionable insights that help management make informed financial decisions.

  • Custom report generation : Tailored reports for executive summaries, department deep-dives, donor reports, or board presentations
  • Performance insights integration : Shares financial data with performance management systems for balanced scorecards and KPIs
  • Decision support tools : Actionable insights that help management answer "what happened, why, and what next?"
Capabilities

Features Of Variance Analysis & Reporting

Everything you need to automatically calculate budget variances, generate comprehensive financial reports, and explore data at granular levels to identify root causes of deviations.

Budget Variance Calculation

Automatically calculates differences between planned and actual figures to highlight deviations.

Detailed Financial Reporting

Generates comprehensive reports that provide insights into financial performance.

Drill-Down Analytics

Allows users to explore data at granular level to identify root causes of variances.

Trend Analysis & Visualization

Uses charts and dashboards to display financial trends over time for better understanding.

Performance Insights Integration

Shares financial data with performance management systems to support evaluation metrics.

Custom Report Generation

Enables users to create tailored reports based on specific organizational needs.

Decision Support Tools

Provides actionable insights that help management make informed financial decisions.

Variance Commentary & Tracking

Allows users to document explanations for significant variances with audit trail.

Multi-Platform

Responsive For Both Desktop and Mobile

Access your variance analysis and reporting from anywhere, on any device. Our platform adapts seamlessly to desktop, tablet, and mobile screens.

Desktop Website Preview
Mobile Website Preview

Frequently asked questions

Explore answers to the most common questions from our trusted partners and clients.

InnoX continuously compares your planned budget figures against actual expenditures and revenues. The system calculates both absolute variances, such as spending $5,000 over budget, and percentage variances, such as exceeding budget by 15%. Positive variances where spending is under budget are shown in green. Negative variances where spending exceeds budget are shown in red. All calculations are automatic and real time. You never build another variance spreadsheet again.

Experience the Difference for Yourself!

  • Explore all features and decide if it’s right for you
  • Upgrade your workflow and launch faster than before
  • Join our community and start learning as you build
InnoX
Innorik
Enterprise
Two people moving forward together through a sunlit park