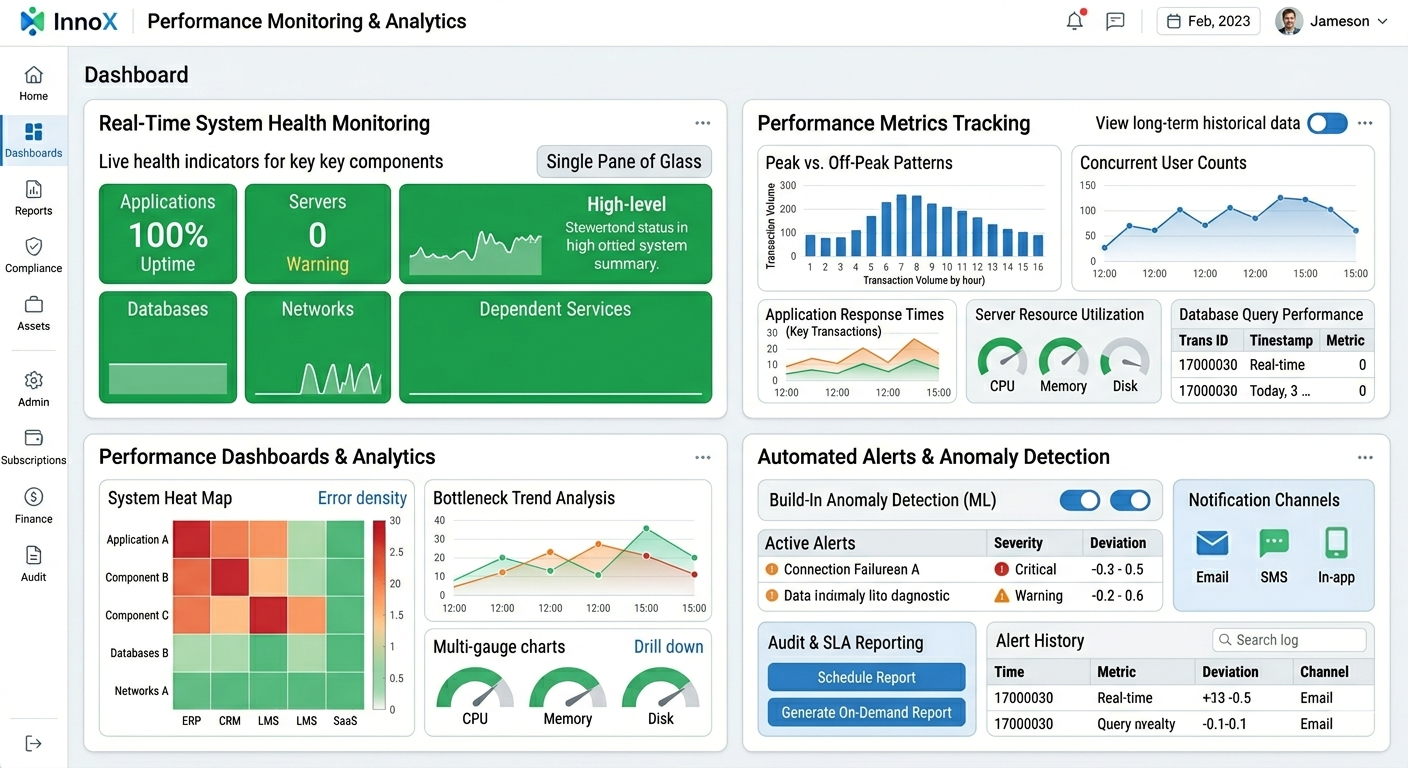
Most organizations piece together system health from a patchwork of disconnected monitoring tools, one dashboard for servers, another for databases, a third for application performance, and perhaps a spreadsheet for user-reported issues. When something goes wrong, your team wastes precious minutes jumping between screens trying to correlate what happened. InnoX eliminates this fragmentation by displaying live health indicators for every component on a single pane of glass. From this unified view, you see the operational status of every application, server, database, network connection, and dependent third-party service that powers your operations. A color-coded health indicator instantly shows you what is working and what is not. A control room operator can see that the telemetry feed is healthy, the sLog Book is responsive, and the biometric access system is online, all without leaving their primary view. When a database server begins showing high latency, you see it immediately alongside the application metrics that depend on that database. The difference between InnoX and traditional monitoring tools is integration. Because InnoX is a unified platform, it understands the relationships between components. It does not just tell you that a server is slow. It tells you that the slow server is hosting the biometric verification service, which is currently processing shift change traffic, and that response times remain within acceptable limits despite the load. That is real-time visibility with context, and it transforms how you manage system health.